Why do we need Stress Strain Curve?
Parts or components in the real world have to withstand external forces during their lifetime. Product designers should consider these external forces with a factor of safety during product design. Therefore new parts are designed in such a way that they can withstand these external forces. Stress-Strain Curve represents the behavior of a material when an external force is applied to it.
Product design engineers and FEA engineers use stress-strain diagrams for manual calculation and simulation studies to understand a material behavior during actual working conditions. This article covers “Engineering and True Stress-Strain-curve” for ductile and brittle materials.
To understand the Stress-Strain graph, let’s first understand what Stress and Strain are in mechanical engineering?
What is Mechanical Stress and Strain?
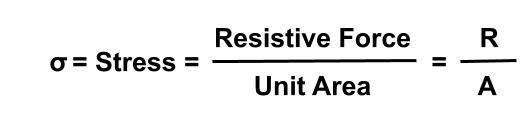
Mechanical stress measures internal resistance exhibited by a body or material due to an external force. Mathematically, mechanical stress is equal to the internal resisting force acting on a body per unit area.
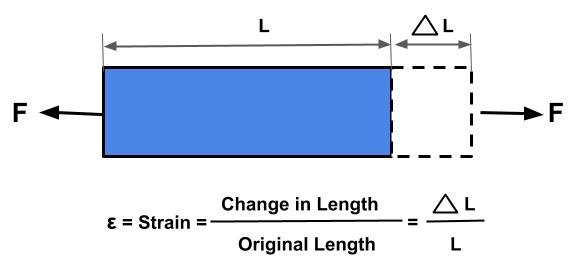
Strain in mechanics measures the deformation in a material due to stress. Mathematically, Mechanical strain is the ratio of change in length to the original length.
How Stress-Strain Graph is Plotted?
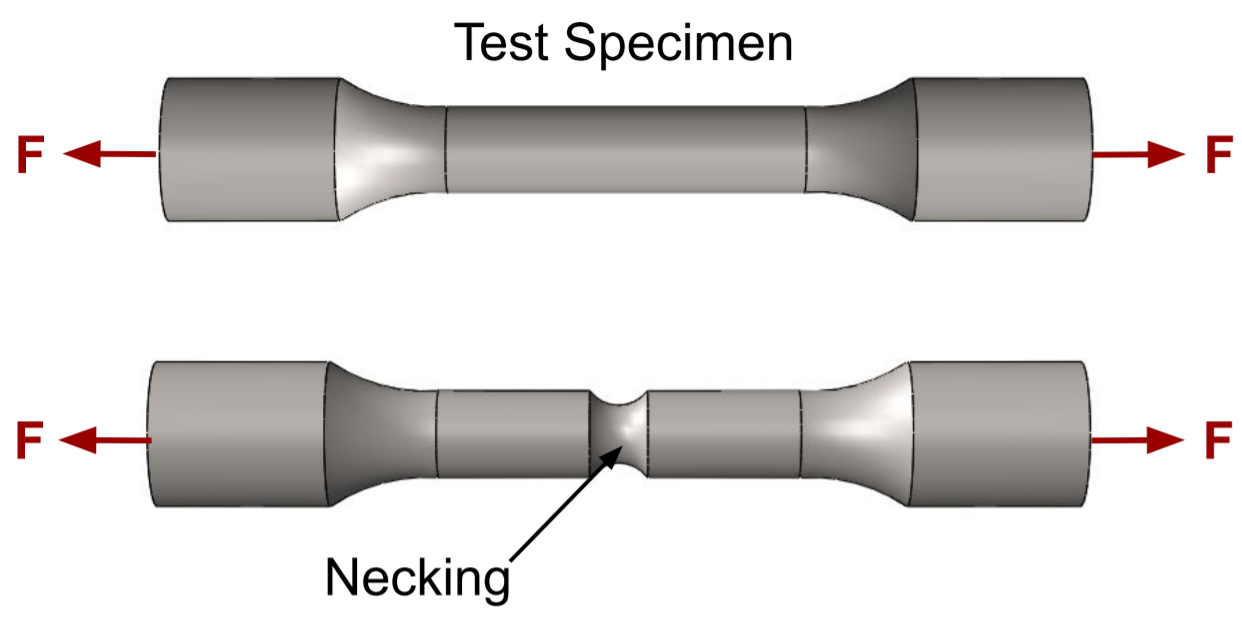
We need to perform material tensile testing on the standard specimen to plot the Engineering and True Stress-Strain Curves using Universal Testing Machine.
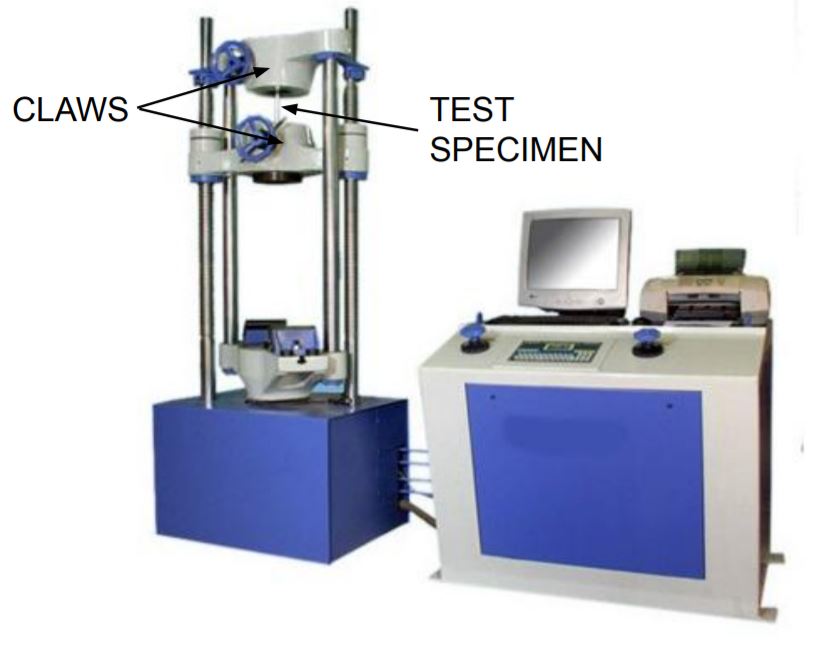
As shown in the above image, UTM consists of two claws. These claws hold and pull the extreme ends of the test specimen at a uniform rate.
During tensile testing, You need to record any change in the length of the test specimen for applied load at various time stamps until the test sample fractures. These values determine variation in stress acting on the test sample for strain value.
Afterward, We can plot the stress-strain graph keeping mechanical stress values on the vertical axis and strain on the horizontal axis.
Stress-Strain Curve for Ductile Materials
Standard test specimens are used to plot Stress Strain Curve for ductile material using a universal testing machine. During this testing, various observations are taken and plotted on the graph. We will discuss various points on the Stress-Strain Graph in detail:
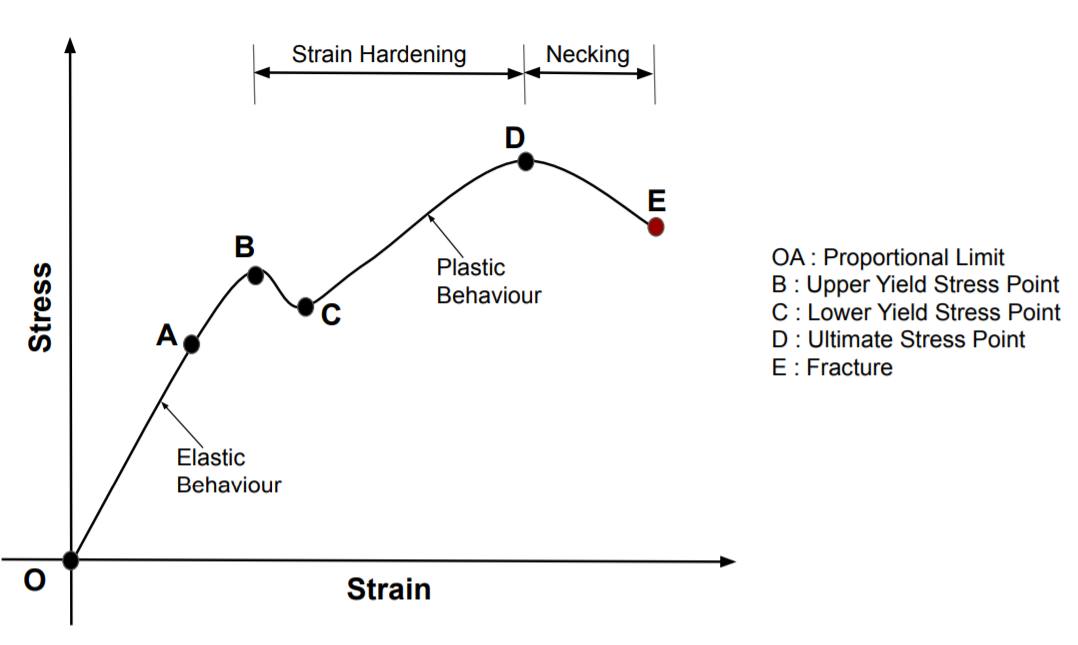
Proportional Limit (From "O" to "A")
According to Hooke’s Law, Proportional limit (O-A) is the limit where stress is directly proportional to strain. The Stress-strain curve is a straight line (from “O” to “A”) within the proportional limit. A material young modulus of elasticity ( ratio of stress and strain) is constant within the proportional limit.
Elastic Limit (From "O" to "B")
The elastic limit for a material is the limit beyond which the material will not come to its original shape when we remove the external force. The material exhibits elastic properties from point A to B (Yield Point) In the stress-strain curve.
If the external load (stress) goes beyond the elastic limit, the material will not come to its original shape.
Upper Yield Point (Point B)
Beyond the elastic limit, ductile material exhibits plastic properties. At the upper yield point, the material required the maximum stress to initiate plastic deformation inside the material. The strength of a material corresponding to Point B is known as yield strength.
Lower Yield Point (Point C)
After Point C, the material length will increase with a small increase in tensile load (stress). In other words, at Lower Yield Point minimum load is required to exhibit plastic behavior in the material.
Ultimate Tensile Strength (Point D)
A Material has the ultimate tensile strength at Point D on the stress-strain diagram. The ultimate tensile strength of a material is the maximum stress a material can withstand before breaking. After point D, necking starts inside the material.
Rapture / Fracture / Breaking Strength (Point E)
Point E is the point where material fractures or breaks. Stress at point-E is known as the breaking strength of a material.
Stress Strain Diagram comparison for Ductile Brittle and Plastic Materials
We can classify most materials available in the market into three categories.
- Ductile
- Brittle
- Plastic Materials
Each of these materials exhibits different behavior when we apply an external force. We can understand the behavior of these materials by analyzing their stress-strain curve.
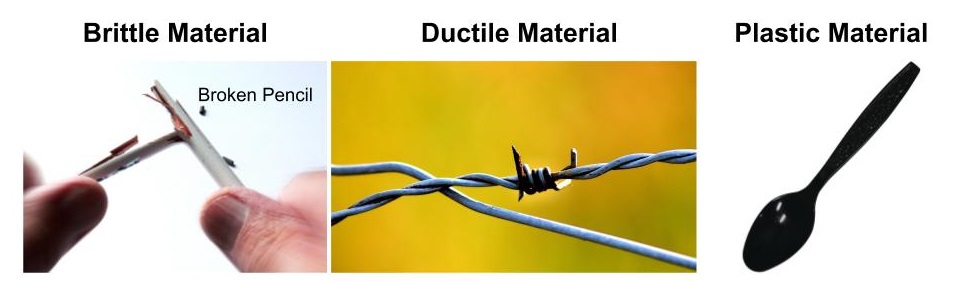
Ductile Materials
A ductile material has different points for ultimate stress and fractures on the stress strain diagram because they have elastic and plastic deformation. Copper, aluminum, and steel are examples of ductile materials.
Example of Ductile Material Behavior
Steel sheets regain their initial position up to the elastic limit during the sheet-metal bending process. But after the elastic limit, the material starts showing plastic behavior and does not come to its original position. If we continue applying force beyond this elastic limit, the material will break at the fracture point.
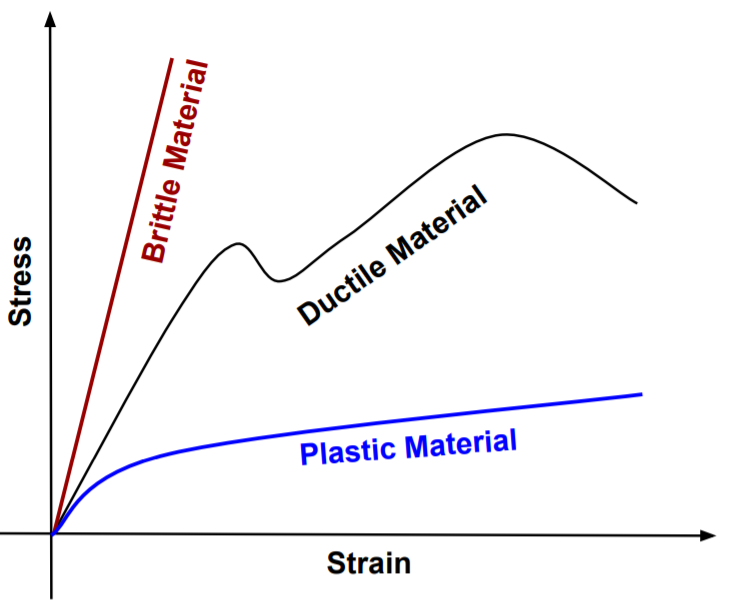
Brittle Materials
Brittle material breaks with small elastic deformation and without plastic deformation due to the external force.
In other words, A brittle material’s elastic limit, yield strength, ultimate tensile strength, and breaking strength are equal. Brittle material absorbs relatively little energy before fracture.
For example, brittle materials such as pencils or glass break suddenly with a snapping sound and small deformation. Ceramic, wood, glass, PMMA, graphite, and cast iron are brittle materials.
Plastic Materials
Similar to ductile materials, plastic materials also exhibit elastic properties up to the proportional limit. But plastic material requires very little stress (compared to the ductile materials) to produce deformation. Plastic materials do not show any work hardening during plastic deformation.
For example, If we apply an external force to bend a plastic spoon. After the elastic limit, the Spoon will not retain its original position.
Why Stress Strain Curve is Used?
Product design engineers and FEA engineers use stress-strain diagrams for manual calculation and simulation studies to understand a material behavior during the product’s actual working conditions.
For example, when we are working on bracket design with a 100kg load capacity. We can verify the bracket design using structural simulation or manual calculations if the material stress strain curve is available.
We can get confidence in the bracket design if the stress acting on the part and factor of safety is within limits.
Engineering Stress-Strain Curve vs True Stress Strain Curve
True-stress and true-strain values are not equal to the engineering stress and engineering strain for engineering materials because the test specimen area reduces rapidly after necking.
Engineering stress-strain diagrams do not consider this reduction in test specimen cross-section area.
Engineering Stress Strain Diagram considers the initial area of the test specimen, whereas in the True Stress-Strain Diagram, we consider the test specimen’s actual area and change in length.
We can conclude the following points from the above engineering stress-strain and true stress-strain graph :
- Engineering stress is always less than the corresponding true stress when Tensile force is applied because we consider the initial test specimen cross-section in engineering stress.
- This initial cross-section area is always more than the actual cross-section area.
- When a tensile force is applied, the engineering strain is always more than the corresponding true strain.
- Only after the necking, a considerable change in the cross-section area of the test specimen occurs. Therefore variation between engineering and true stresses becomes more prominent after necking.
Commonly Asked Questions
The Stress-Strain graph indicates the impact of applied external force per unit area on a material. Therefore it is used by product design engineers, FEA engineers for manual calculation and simulation studies to understand a material behavior during product actual working conditions.
The area under the stress-strain diagram till the yield point comes in the elastic region.
To draw a true stress-strain curve the actual cross-section area (at the time of measurement) of the test specimen is considered.
Whereas in the Engineering Stress-strain Diagram, the initial cross-section area (at the start of the test) is considered.
The area under the stress-strain graph till breakpoint indicates the toughness of a material.
To sum up, Engineers use a material stress-strain diagram for material selection and structure analysis. It helps designers in material selection and creating more optimized designs.
We will keep updating this article on the Stress strain curve. Add your comments or questions on the stress strain diagram in the comment box. We suggest you also read this article on the mechanical properties of materials.